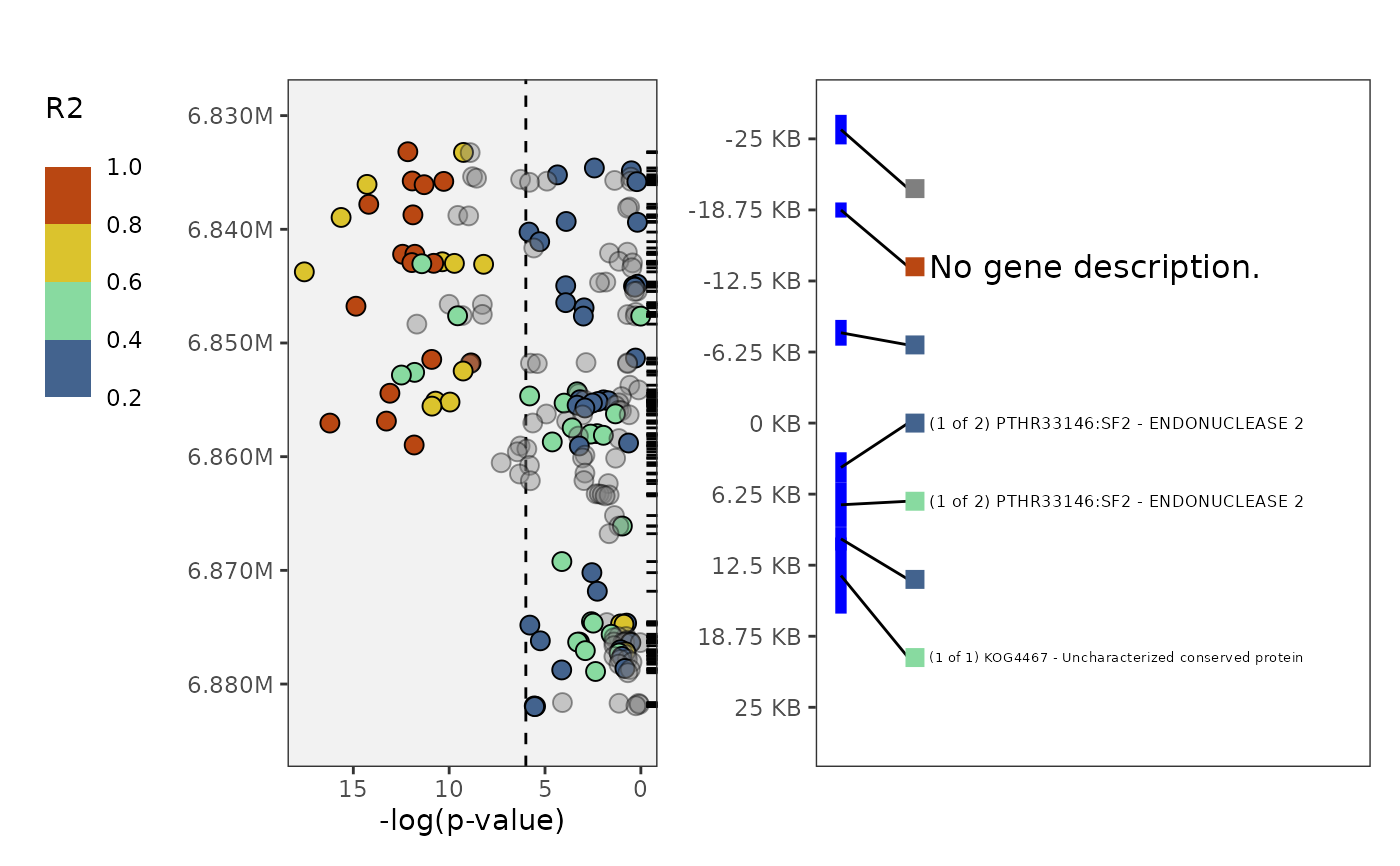
Make a plot that lines up manhattan and gene locations
Usage
plot_panvar(
  panvar.table.list = NULL,
  gwas.res = NULL,
  ld.list = NULL,
  annotation.table = NULL,
  pvals.in.log = T,
  plot.r2.thresh = 0.2,
  unplotted.alpha = 0.4,
  window,
  sig.line,
  qualitative.annotation = NULL,
  qualitative.shape.scale = NULL,
  quantitative.annotation = NULL,
  quantitative.fill.scale = NULL,
  plot.title = "",
  include.gene.id = F,
  highlight.gene.ids = NULL,
  gene.highlight.color = "red",
  annotation.point.variable = "LD",
  annotation.point.scale = NULL,
  plot.effect = F,
  plot.text.size = 11,
  plot.legend.size = 1.2
)
Arguments
- panvar.table.list
list, output from make_panvar_tables. Provide either this list or both gwas.res and ld.list.
- gwas.res
data.frame of all gwas results, should contain columns (CHR, POS, PVAL), corresponding to (chromosome, physical position, and pvalue).
- ld.list
list, output of get_ld_in_window
- annotation.table
table with annotations with columns (geneID, CHR, start, end, annotation). start and end correspond to base-pair coordinates of start and end of gene. CHR is chromosome of gene.
- pvals.in.log
boolean, if TRUE PVAL column has already been converted to -log10(pvalue)
- plot.r2.thresh
minimum LD with qtl snps to plot snps colored by LD
- unplotted.alpha
numeric, number from 0 to 1 to indicate alpha values of snps below the plot.r2.thresh. To not plot these snps set value to 0.
- window
numeric, total window size in KB, all variants within .5 * window are calculated.
- sig.line
numeric, -log10(p) value to draw line on plot
- qualitative.annotation
character, column in
gwas.resthat contains qualitative annotations. For example impact grades from snpeff. See format_snpeff_annotations. Will be plotted as shapes. Only accepts up to 5 classes. "IMPACT" and "IMPACT_PLUS" are special cases that will have a pre-assigned scale used if supplied here.- qualitative.shape.scale
ggplot scale, an object with a stored call to ggplot2::scale_shape_manual. More often an output of the function make_consistent_scale.
- quantitative.annotation
character, column in
gwas.resthat contains quantitative annotations. For example, variant effect scores. Will be plotted as fill to points.- quantitative.fill.scale
character or scale object, either a character indicating the
optionparameter passed to ggplot2::scale_fill_viridis_b that alters the color scale used. Or a previous call to a ggplot2 fill scale for example ggplot2::scale_fill_stepsn.- plot.title
character, a title for the plot
- include.gene.id
boolean, if TRUE,
geneIDcolumn will be included in annotation plot.- highlight.gene.ids
character, vector of geneID's that will be highlighted in the plot.
- gene.highlight.color
character, a color to highlight specific geneIDs
- annotation.point.variable
character, variable in
annotation.tablethat indicates how to color points plotted next to gene descriptions. If not supplied, no points are plotted. The input "LD" is reserved and will use LD.- annotation.point.scale
ggplot2 scale object, a color scale to customize how point.color is displayed.
- plot.effect
boolean, if TRUE include volcano style effect vs pvalue plot as inset.
Examples
# organize options
tag.snp <- "Chr_05-6857045"
gwas.df <- read.csv(system.file(
    "extdata",
    "PanvarExample_GLM_GWASresults.csv",
    package = "panvaR"))
annotation.table <- read.csv(system.file(
    "extdata",
    "Setaria_shattering_annotation.csv",
    package = "panvaR"))
plink.path <- bigsnpr::download_plink2()
temp.dir <- file.path(tempdir(), "panvar_ex")
dir.create(temp.dir, showWarnings = FALSE)
geno.bed.filename <- "Setaria_shattering_example_pruned.bed"
geno.bed.directory <- system.file("extdata", package="panvaR")

# make input tables
tables <- make_panvar_tables(
  gwas.res = gwas.df,
  tag.snp = tag.snp,
  annotation.table = annotation.table,
  plink.path = plink.path,
  pvals.in.log = F,
  geno.bed.filename = geno.bed.filename,
  geno.bed.directory = geno.bed.directory,
  window = 25,
  temp.dir = temp.dir,
  compute.scores = FALSE,
  snp.to.gene.buffer = 0)
#> Calculating LD
#> Generating snp to gene correspondence

# make plot
plot_panvar(
  panvar.table.list = tables,
  pvals.in.log = FALSE,
  window = 25,
  sig.line = 6)
#> Making manhattan
#> Making annotation plot


# clean up
unlink(temp.dir, recursive = TRUE)
# clean up
unlink(temp.dir, recursive = TRUE)