Models fit using growthSS inputs by fitGrowth (and similar models made through other means) can be visualized easily using this function.
Usage
growthPlot(
  fit,
  form,
  groups = NULL,
  df = NULL,
  timeRange = NULL,
  facetGroups = TRUE,
  groupFill = !facetGroups,
  hierarchy_value = NULL
)
Arguments
- fit
A model fit object (or a list of
nlrqmodels) as returned byfitGrowth.- form
A formula similar to that in
growthSSinputs (or thepcvrFormpart of the output) specifying the outcome, predictor, and grouping structure of the data asoutcome ~ predictor|individual/group. Generally this is given directly from the growthSS output (ss$pcvrForm). If the formula does not include both individuals and groups then lines from the data will not be plotted which may be best if your data does not specify unique individuals and your model does not include autocorrelation.- groups
An optional set of groups to keep in the plot. Defaults to NULL in which case all groups in the model are plotted.
- df
A dataframe to use in plotting observed growth curves on top of the model and for making predictions.
- timeRange
An optional range of times to use. This can be used to view predictions for future data if the available data has not reached some point (such as asymptotic size).
- facetGroups
logical, should groups be separated in facets? Defaults to TRUE.
- groupFill
logical, should groups have different colors? Defaults to the opposite of facetGroups. If TRUE then viridis colormaps are used in the order c('plasma', 'mako', 'viridis', 'inferno', 'cividis', 'magma', 'turbo', 'rocket'). Alternatively this can be given as a vector of viridis colormap names to use in a different order than above. Note that for brms models this is ignored except if used to specify a different viridis color map to use.
- hierarchy_value
If a hierarchical model is being plotted, what value should the hierarchical predictor be? If left NULL (the default) the mean value is used. If this is >1L then the x axis will use the hierarchical variable from the model at the mean of the timeRange (mean of x values in the model if timeRange is not specified).
Value
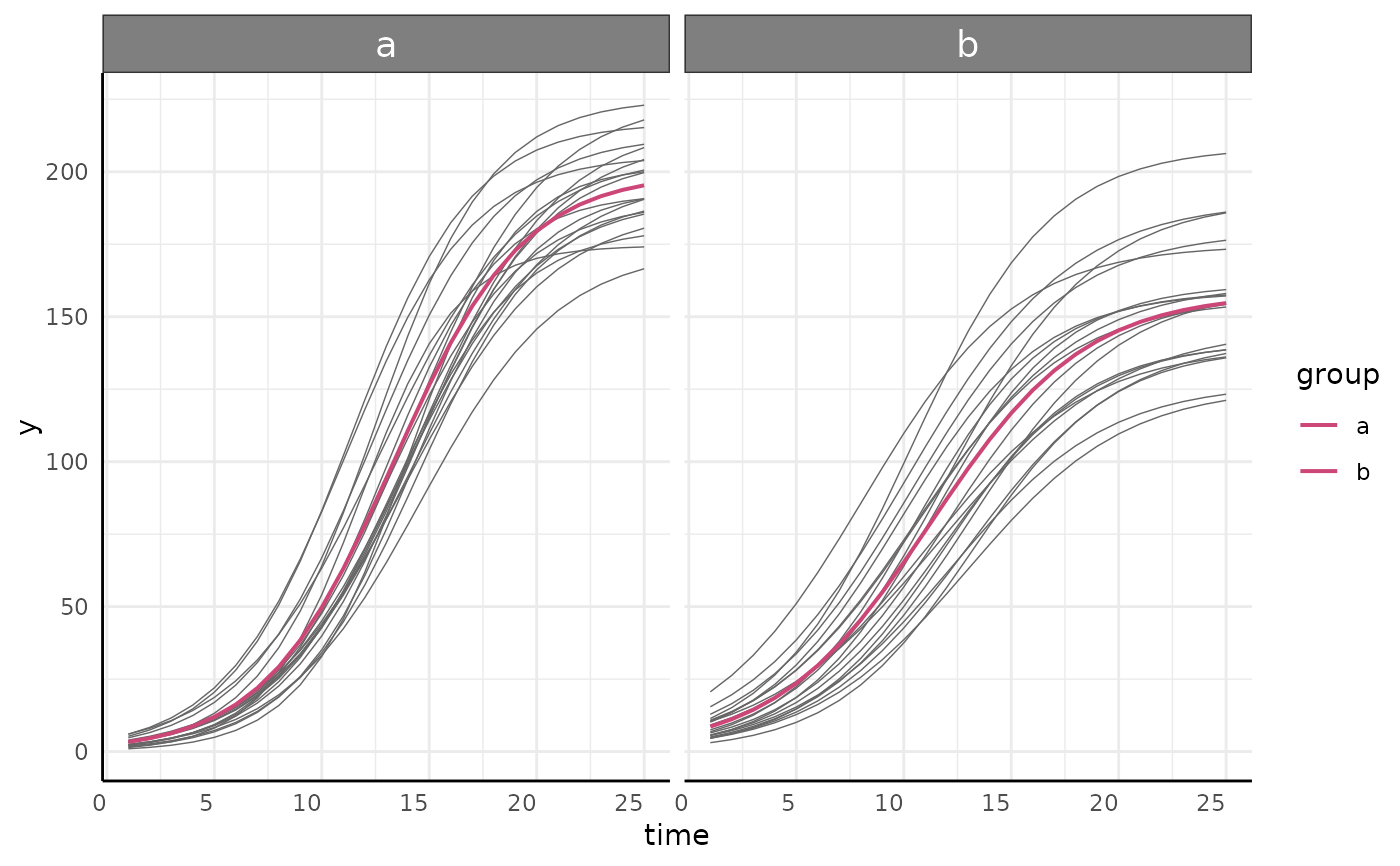
Returns a ggplot showing a brms model's credible intervals and optionally the individual growth lines.
See also
growthSS and fitGrowth for making compatible models, testGrowth for hypothesis testing on compatible models.
Examples
simdf <- growthSim("logistic",
  n = 20, t = 25,
  params = list("A" = c(200, 160), "B" = c(13, 11), "C" = c(3, 3.5))
)
ss <- growthSS(
  model = "logistic", form = y ~ time | id / group,
  df = simdf, type = "nls"
)
#> Individual is not used with type = 'nls'.
fit <- fitGrowth(ss)
growthPlot(fit, form = ss$pcvrForm, df = ss$df)