Function to visualize brms models similar to those made using growthSS outputs.
Source:R/brmPlot.R
brmPlot.RdModels fit using growthSS inputs by fitGrowth (and similar models made through other
means) can be visualized easily using this function. This will generally be called by
growthPlot.
Usage
brmPlot(
  fit,
  form,
  df = NULL,
  groups = NULL,
  timeRange = NULL,
  facetGroups = TRUE,
  hierarchy_value = NULL,
  vir_option = "plasma"
)
Arguments
- fit
A brmsfit object, similar to those fit with
growthSSoutputs.- form
A formula similar to that in
growthSSinputs specifying the outcome, predictor, and grouping structure of the data asoutcome ~ predictor|individual/group.- df
An optional dataframe to use in plotting observed growth curves on top of the model.
- groups
An optional set of groups to keep in the plot. Defaults to NULL in which case all groups in the model are plotted.
- timeRange
An optional range of times to use. This can be used to view predictions for future data if the available data has not reached some point (such as asymptotic size), although prediction using splines outside of the observed range is not necessarily reliable.
- facetGroups
logical, should groups be separated in facets? Defaults to TRUE.
- hierarchy_value
If a hierarchical model is being plotted, what value should the hierarchical predictor be? If left NULL (the default) the mean value is used. If this is >1L then the x axis will use the hierarchical variable from the model at the mean of the timeRange (mean of x values in the model if timeRange is not specified).
- vir_option
Viridis color scale to use for plotting credible intervals. Defaults to "plasma".
Value
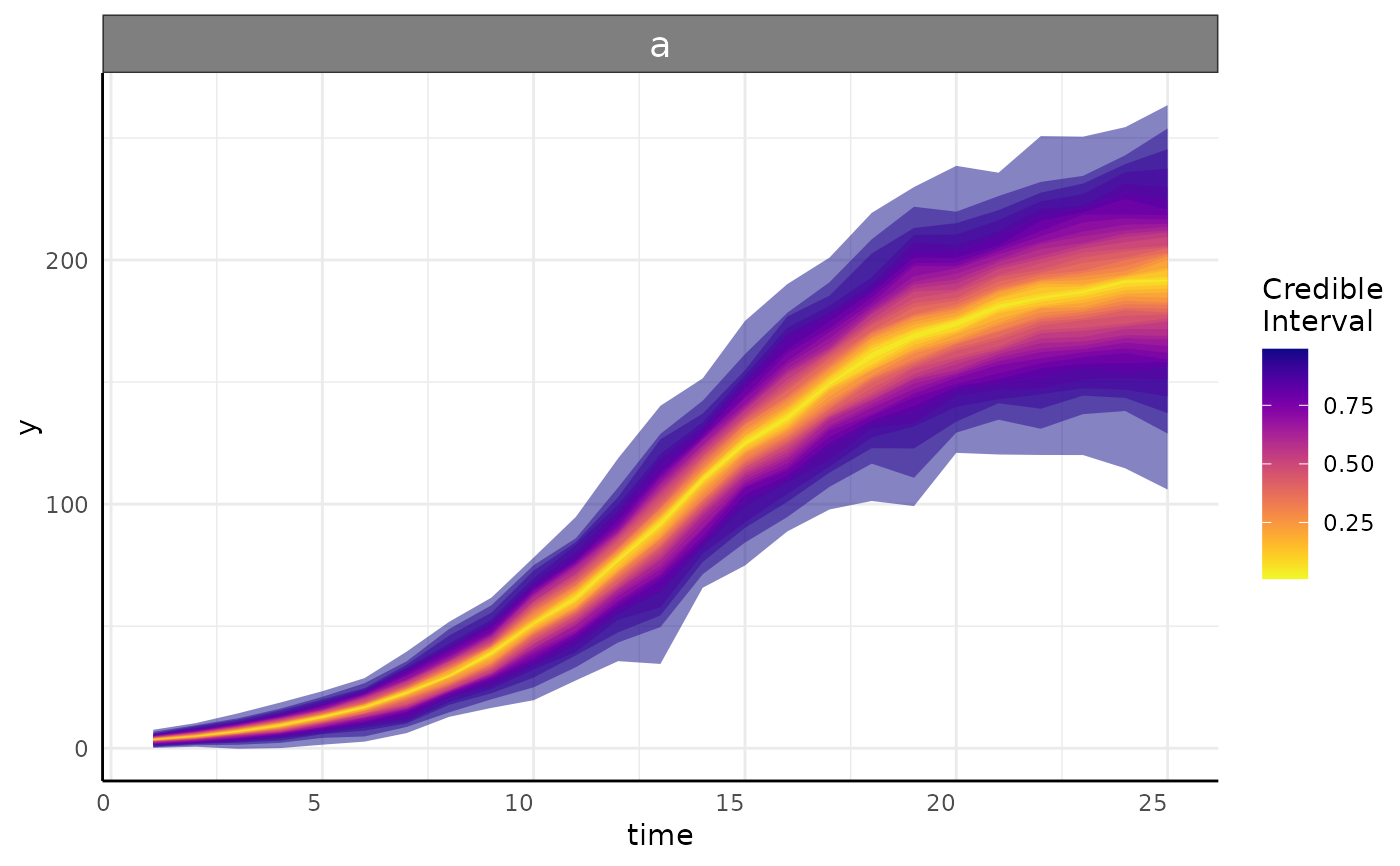
Returns a ggplot showing a brms model's credible intervals and optionally the individual growth lines.
Examples
# \donttest{
simdf <- growthSim(
  "logistic",
  n = 20, t = 25,
  params = list("A" = c(200, 160), "B" = c(13, 11), "C" = c(3, 3.5))
)
ss <- growthSS(
  model = "logistic", form = y ~ time | id / group, sigma = "spline",
  list("A" = 130, "B" = 10, "C" = 3),
  df = simdf, type = "brms"
)
fit <- fitGrowth(ss, backend = "cmdstanr", iter = 500, chains = 1, cores = 1)
#> Start sampling
#> Init values were only set for a subset of parameters.
#> Missing init values for the following parameters:
#> Intercept_sigma, bs_sigma, zs_sigma_1_1, sds_sigma_1, zs_sigma_2_1, sds_sigma_2, Intercept_nu
#>
#> To disable this message use options(cmdstanr_warn_inits = FALSE).
#> Running MCMC with 1 chain...
#>
#> Chain 1 Iteration:   1 / 500 [  0%]  (Warmup)
#> Chain 1 Informational Message: The current Metropolis proposal is about to be rejected because of the following issue:
#> Chain 1 Exception: student_t_lpdf: Location parameter[1] is -nan, but must be finite! (in '/tmp/RtmpfB9aQg/model-1eff443ddd08.stan', line 131, column 4 to column 48)
#> Chain 1 If this warning occurs sporadically, such as for highly constrained variable types like covariance matrices, then the sampler is fine,
#> Chain 1 but if this warning occurs often then your model may be either severely ill-conditioned or misspecified.
#> Chain 1
#> Chain 1 Informational Message: The current Metropolis proposal is about to be rejected because of the following issue:
#> Chain 1 Exception: student_t_lpdf: Scale parameter[1] is 0, but must be positive finite! (in '/tmp/RtmpfB9aQg/model-1eff443ddd08.stan', line 131, column 4 to column 48)
#> Chain 1 If this warning occurs sporadically, such as for highly constrained variable types like covariance matrices, then the sampler is fine,
#> Chain 1 but if this warning occurs often then your model may be either severely ill-conditioned or misspecified.
#> Chain 1
#> Chain 1 Iteration: 100 / 500 [ 20%]  (Warmup)
#> Chain 1 Informational Message: The current Metropolis proposal is about to be rejected because of the following issue:
#> Chain 1 Exception: student_t_lpdf: Scale parameter[501] is inf, but must be positive finite! (in '/tmp/RtmpfB9aQg/model-1eff443ddd08.stan', line 131, column 4 to column 48)
#> Chain 1 If this warning occurs sporadically, such as for highly constrained variable types like covariance matrices, then the sampler is fine,
#> Chain 1 but if this warning occurs often then your model may be either severely ill-conditioned or misspecified.
#> Chain 1
#> Chain 1 Iteration: 200 / 500 [ 40%]  (Warmup)
#> Chain 1 Iteration: 251 / 500 [ 50%]  (Sampling)
#> Chain 1 Iteration: 350 / 500 [ 70%]  (Sampling)
#> Chain 1 Iteration: 450 / 500 [ 90%]  (Sampling)
#> Chain 1 Iteration: 500 / 500 [100%]  (Sampling)
#> Chain 1 finished in 25.6 seconds.
#> Warning: 1 of 250 (0.0%) transitions ended with a divergence.
#> See https://mc-stan.org/misc/warnings for details.
growthPlot(fit = fit, form = y ~ time | group, groups = "a", df = ss$df)

# }
# }