Function for plotting iterations of posterior distributions
Source:R/distPlot.R
distributionPlot.RdFunction for plotting iterations of posterior distributions
Usage
distributionPlot(
  fits,
  form,
  df,
  priors = NULL,
  params = NULL,
  maxTime = NULL,
  patch = TRUE,
  virOptions = c("plasma", "mako", "viridis", "cividis", "magma", "turbo", "inferno",
    "rocket")
)
Arguments
- fits
A list of brmsfit objects following the same data over time. Currently checkpointing is not supported.
- form
A formula describing the growth model similar to
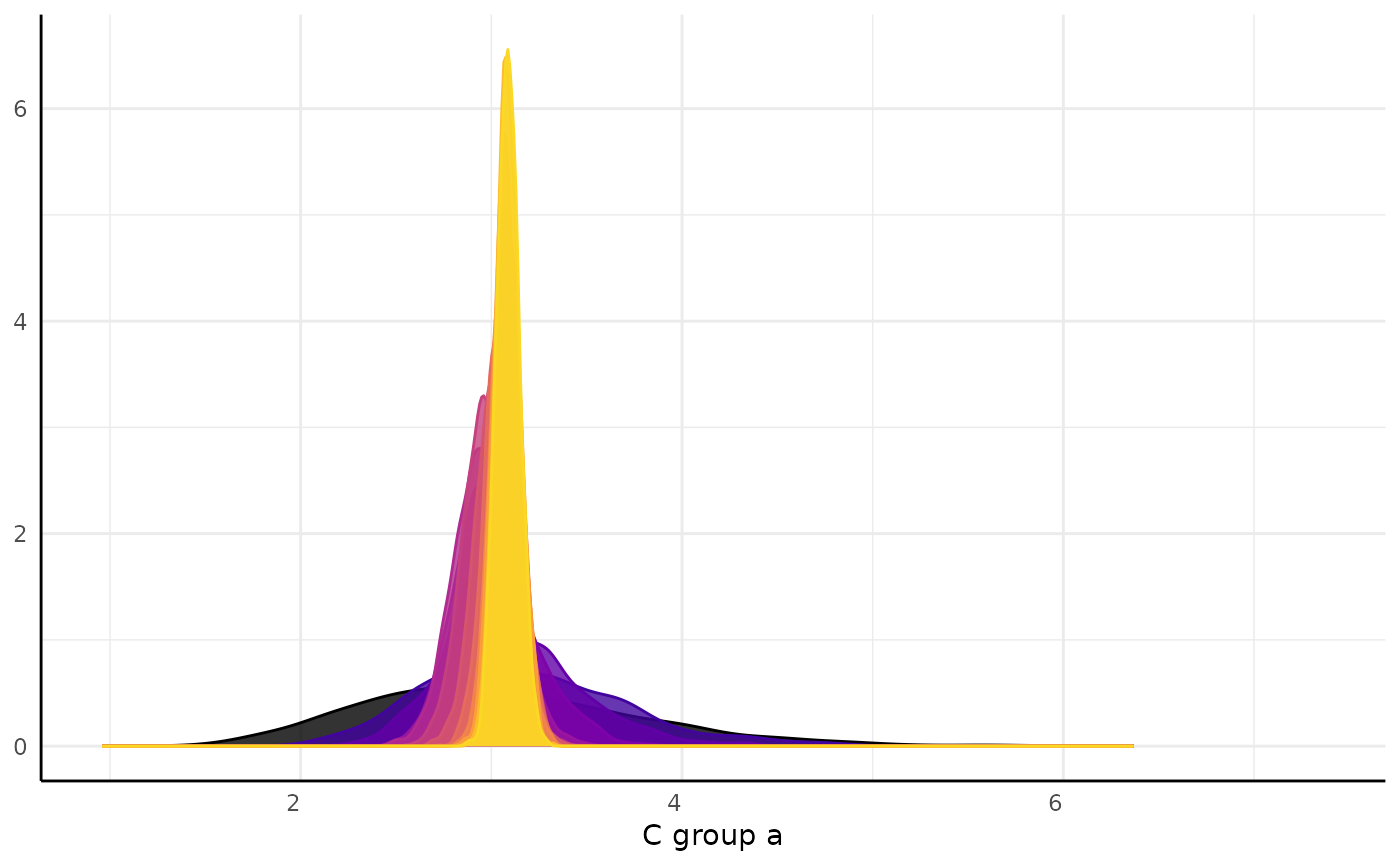
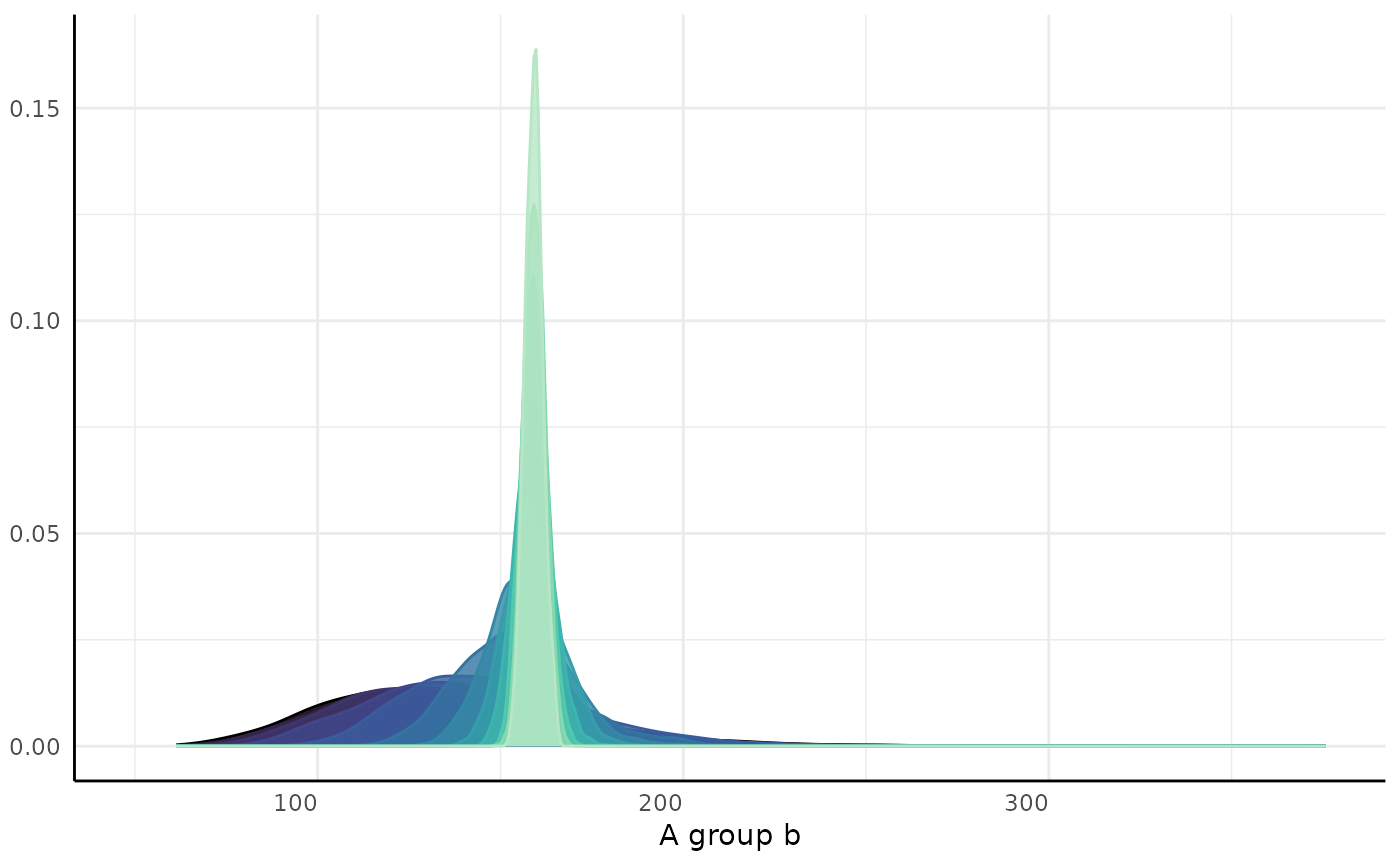
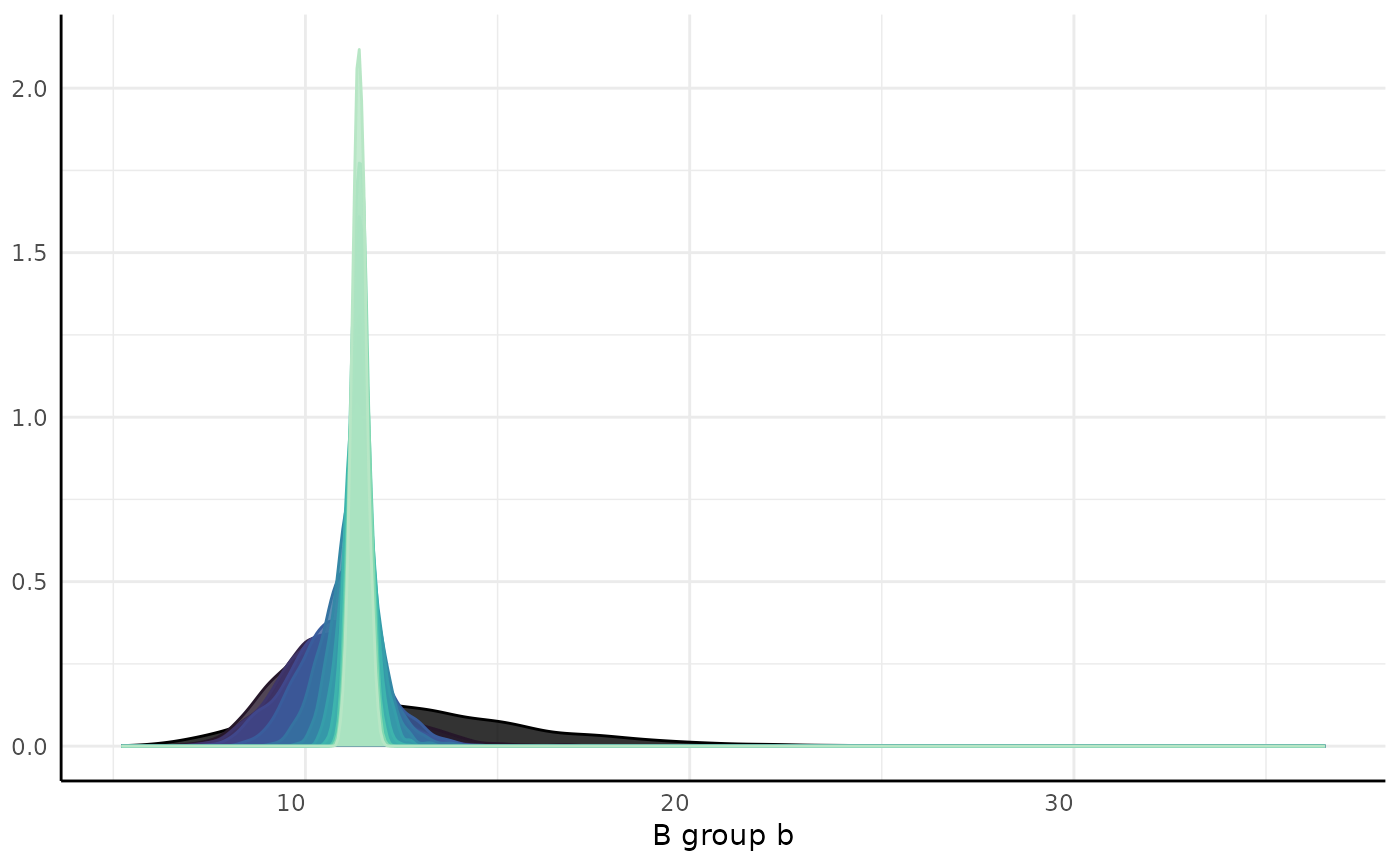
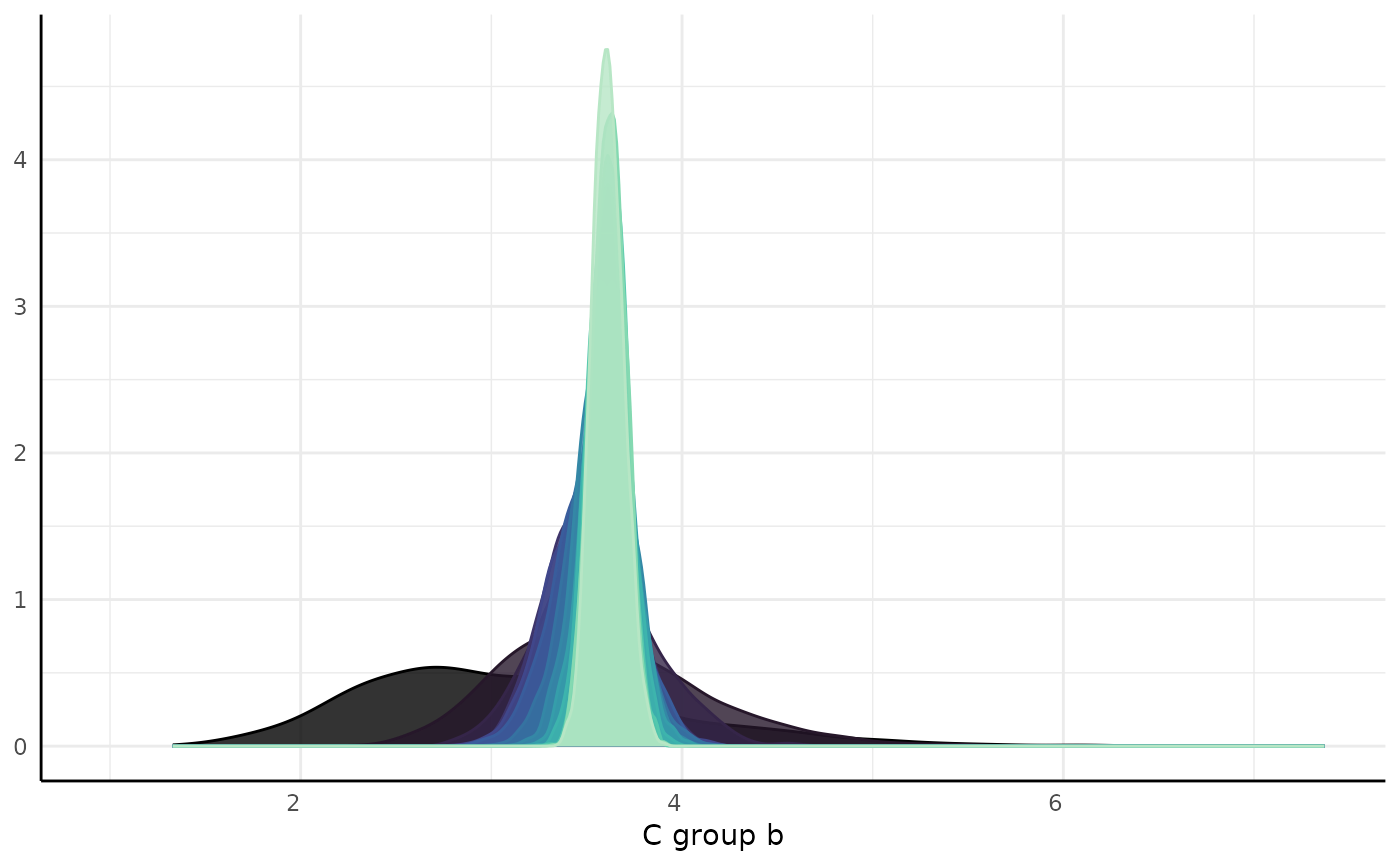
growthSSandbrmPlotsuch as: outcome ~ predictor |individual/group- df
data used to fit models (this is used to plot each subject's trend line).
- priors
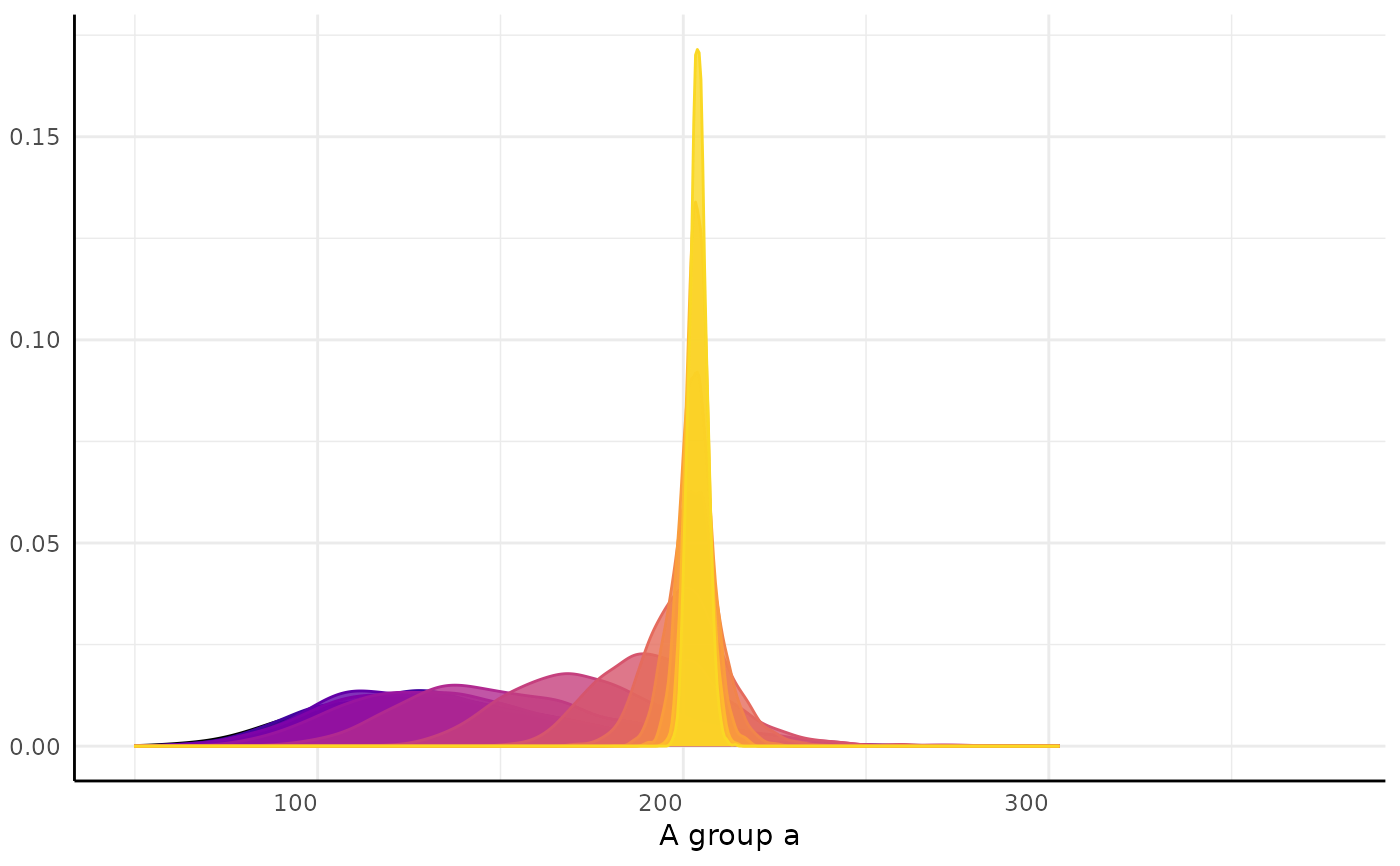
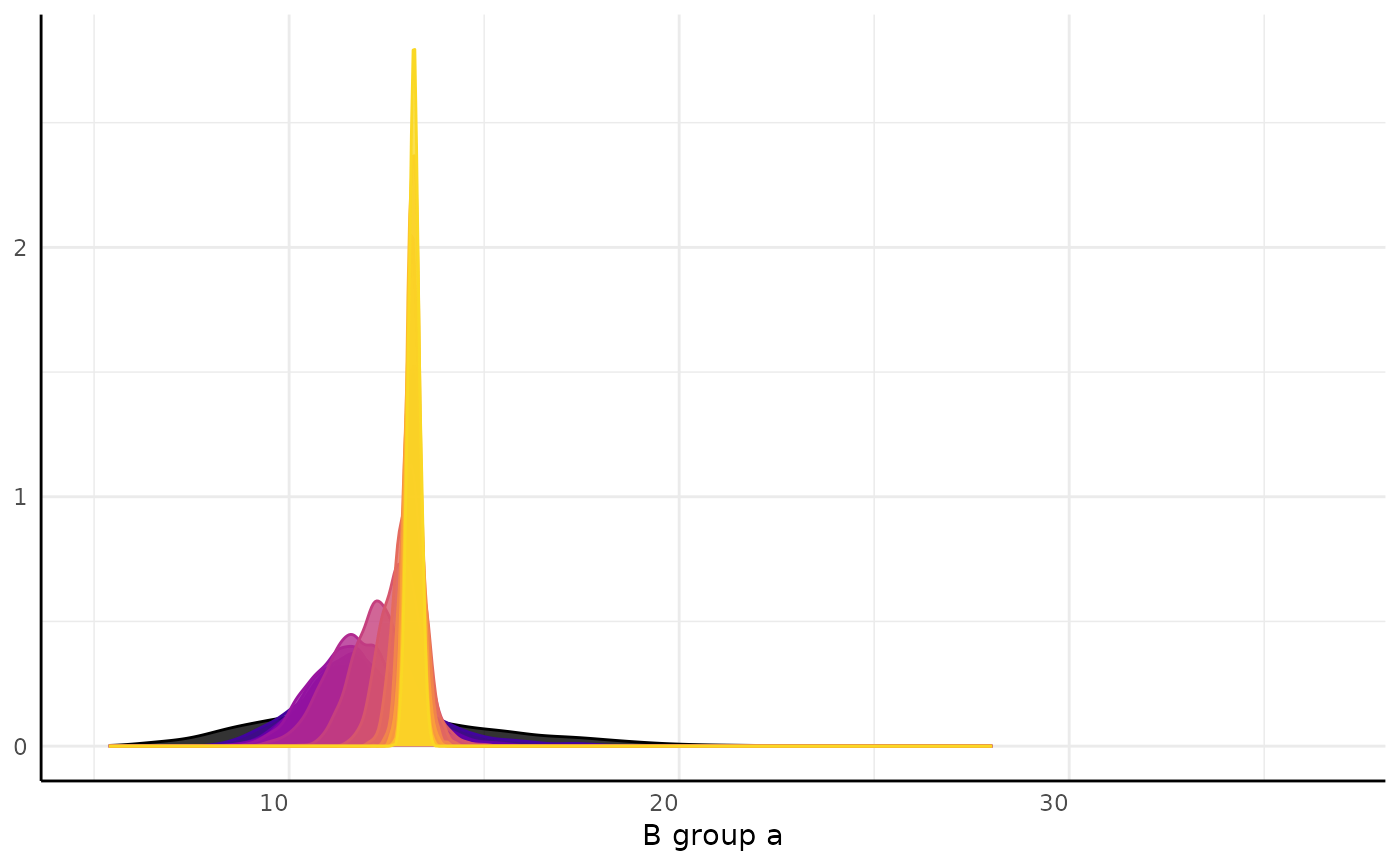
a named list of samples from the prior distributions for each parameter in
params. This is only used if sample_prior=FALSE in the brmsfit object. If left NULL then no prior is included.- params
a vector of parameters to include distribution plots of. Defaults to NULL which will use all parameters from the top level model. Note that these parameters have to be estimated per each group in the model, if you have interecept only terms (estimated once across all groups) then manually specify params to not include those.
- maxTime
Optional parameter to designate a max time not observed in the models so far
- patch
Logical, should a patchwork plot be returned or should lists of ggplots be returned?
- virOptions
A vector of names or letters for which viridis maps to use for each group.
Examples
# \donttest{
f <- "https://raw.githubusercontent.com/joshqsumner/pcvrTestData/main/brmsFits.rdata"
tryCatch(
{
print(load(url(f)))
library(brms)
library(ggplot2)
library(patchwork)
fits <- list(fit_3, fit_15)
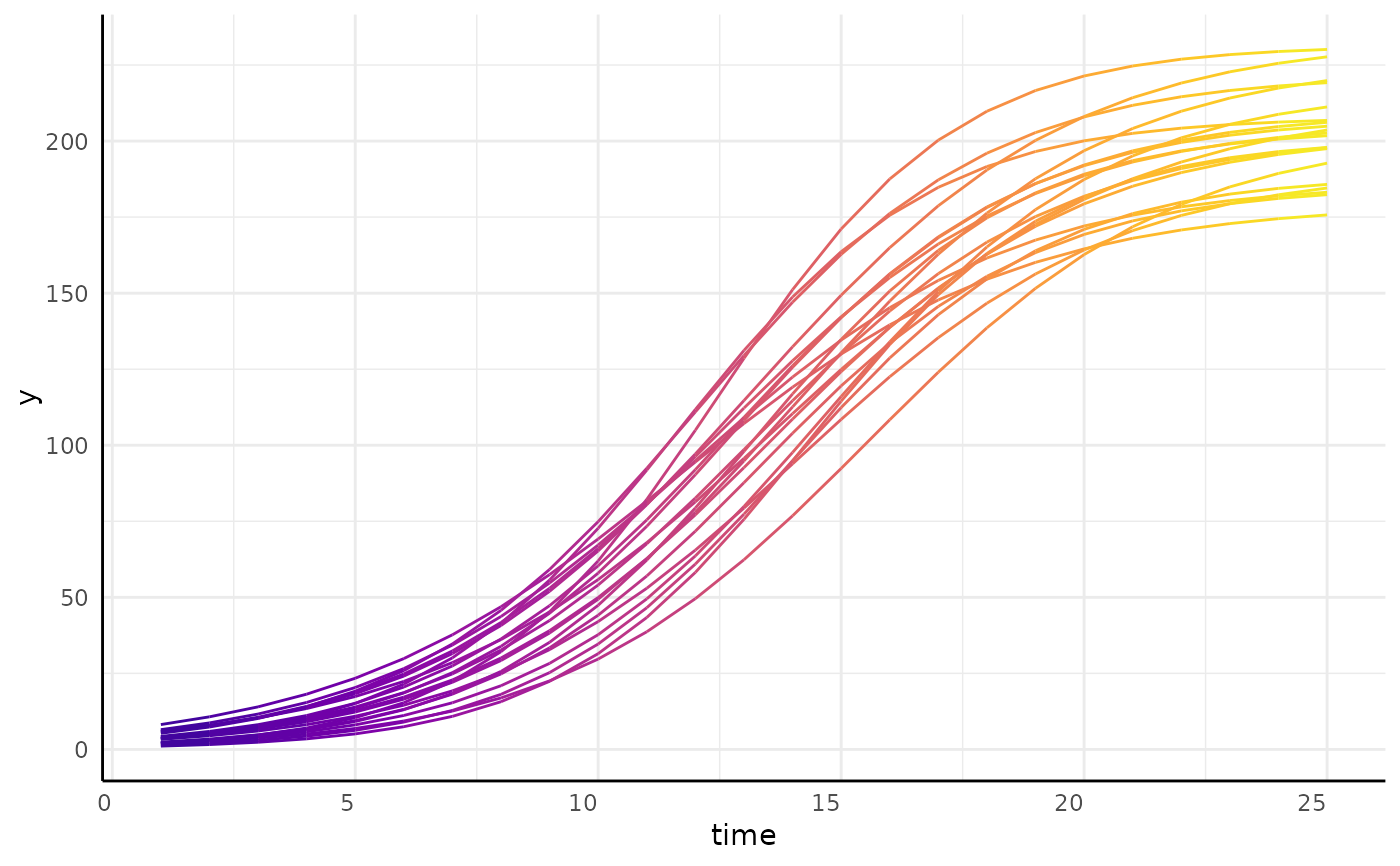
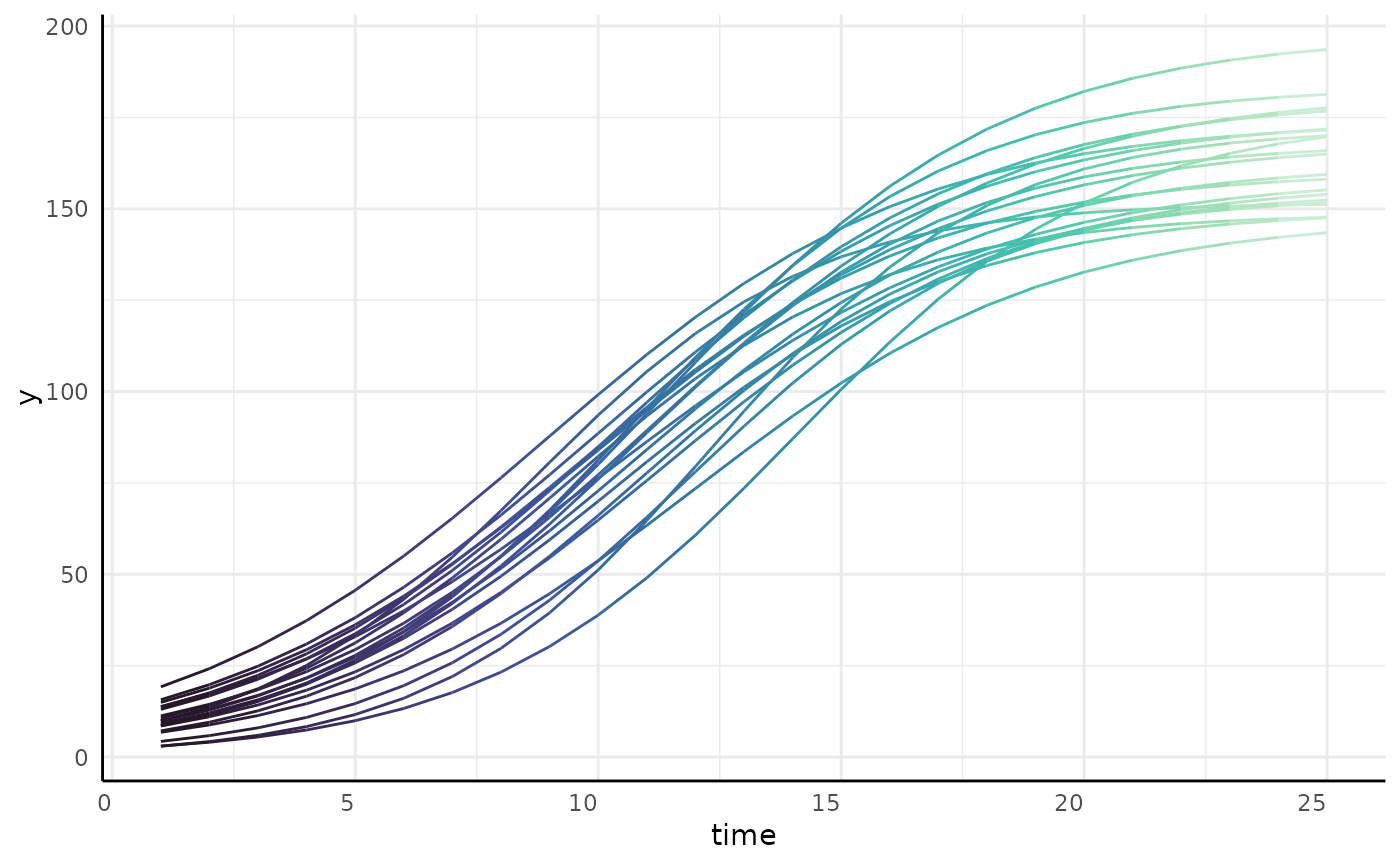
form <- y~time | id / group
priors <- list(
"phi1" = rlnorm(2000, log(130), 0.25),
"phi2" = rlnorm(2000, log(12), 0.25),
"phi3" = rlnorm(2000, log(3), 0.25)
)
params <- c("A", "B", "C")
d <- simdf
maxTime <- NULL
patch <- TRUE
from3to25 <- list(
fit_3, fit_5, fit_7, fit_9, fit_11,
fit_13, fit_15, fit_17, fit_19, fit_21, fit_23, fit_25
)
distributionPlot(
fits = from3to25, form = y ~ time | id / group,
params = params, d = d, priors = priors, patch = FALSE
)
distributionPlot(
fits = from3to25, form = y ~ time | id / group,
params = params, d = d, patch = FALSE
)
},
error = function(e) {
message(e)
}
)
#> [1] "fit_3" "fit_5" "fit_7" "fit_9" "fit_11" "fit_13" "fit_15" "fit_17"
#> [9] "fit_19" "fit_21" "fit_23" "fit_25" "simdf"
#> Loading required package: Rcpp
#> Loading 'brms' package (version 2.23.0). Useful instructions
#> can be found by typing help('brms'). A more detailed introduction
#> to the package is available through vignette('brms_overview').
#>
#> Attaching package: ‘brms’
#> The following object is masked from ‘package:stats’:
#>
#> ar
#> [[1]]
#> [[1]][[1]]
 #>
#> [[1]][[2]]
#>
#> [[1]][[2]]
 #>
#>
#> [[2]]
#> [[2]][[1]]
#> [[2]][[1]][[1]]
#>
#>
#> [[2]]
#> [[2]][[1]]
#> [[2]][[1]][[1]]
 #>
#> [[2]][[1]][[2]]
#>
#> [[2]][[1]][[2]]
 #>
#> [[2]][[1]][[3]]
#>
#> [[2]][[1]][[3]]
 #>
#>
#> [[2]][[2]]
#> [[2]][[2]][[1]]
#>
#>
#> [[2]][[2]]
#> [[2]][[2]][[1]]
 #>
#> [[2]][[2]][[2]]
#>
#> [[2]][[2]][[2]]
 #>
#> [[2]][[2]][[3]]
#>
#> [[2]][[2]][[3]]
 #>
#>
#>
# }
#>
#>
#>
# }